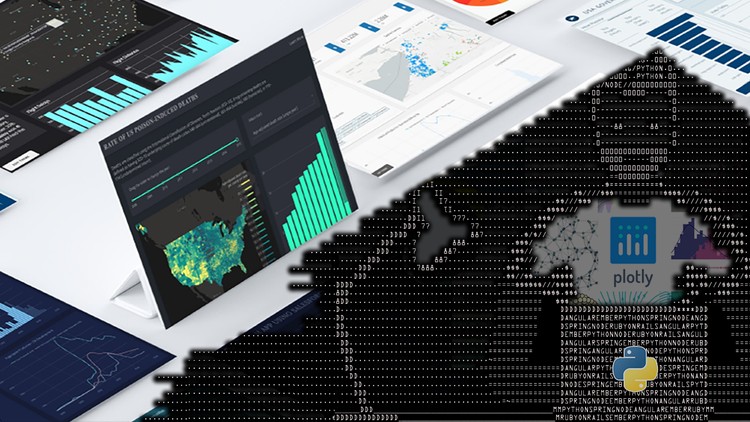
Build Interactive Plotly & Dash Dashboards with Data Science
Updated on
Course overview
- Provider
- Udemy
- Course type
- Paid course
- Level
- Intermediate
- Duration
- 9 hours
- Lessons
- 24 lessons
- Certificate
- Available on completion
- Course author
- Profesor Pip
-
- How to build interactive dashboards with Python that work with advanced interactive components
- How to build interactive data science solutions
Description
Learn how to build integrated interactive dashboards that focus on telling stories with data science.
This course is going to build off the creations of dashboard components, every lesson and dashboard developed is new & never before seen as you enforce the fundamentals to dashboard creation and build off them until you are a pro at telling a story with data. This isn't the basic static show a graph course as our main focus is interactivity and making out dashboards update with our client's parameters in real-time.
Similar courses

-
25 hours
-
165 lessonsCertificate

-
22 hours
-
155 lessonsCertificate

-
45 hours
-
320 lessonsCertificate